
Avatars and Worlds for Gaming, Concerts and STEM
AI-Driven Experiences
Gaming, Industrial Education, STEM, Concerts, Art, Events
Welcome to Xyris XR Immersive Worlds
Immersive AI-driven 3D Worlds and Avatars
Xyris XR develops immersive AI-driven 3D worlds for STEM, Entertainment, Meditation, Adventure Gaming, Counseling and Online Concerts. We also create AI-driven conversational avatars. Our worlds are built to a high visual standard, with collaboration and imagination at their core. Partnering with industry-leading creatives, we bring innovative experiences to scientists, gamers, and creators.
About Xyris XR
Creating Immersive Experiences
At Xyris XR, we are passionate about creating immersive experiences that blend gaming, art, AI, and storytelling. Our team of talented designers, developers, and artists work together to build cutting-edge 3D worlds and avatars that captivate audiences. With a focus on quality and innovation, our creations push the boundaries of what is possible in virtual reality and the metaverse.
50
3D Worlds Created
ChatGPT
Conversational Avatars
Generative Art
Concepts & Digital Fashion
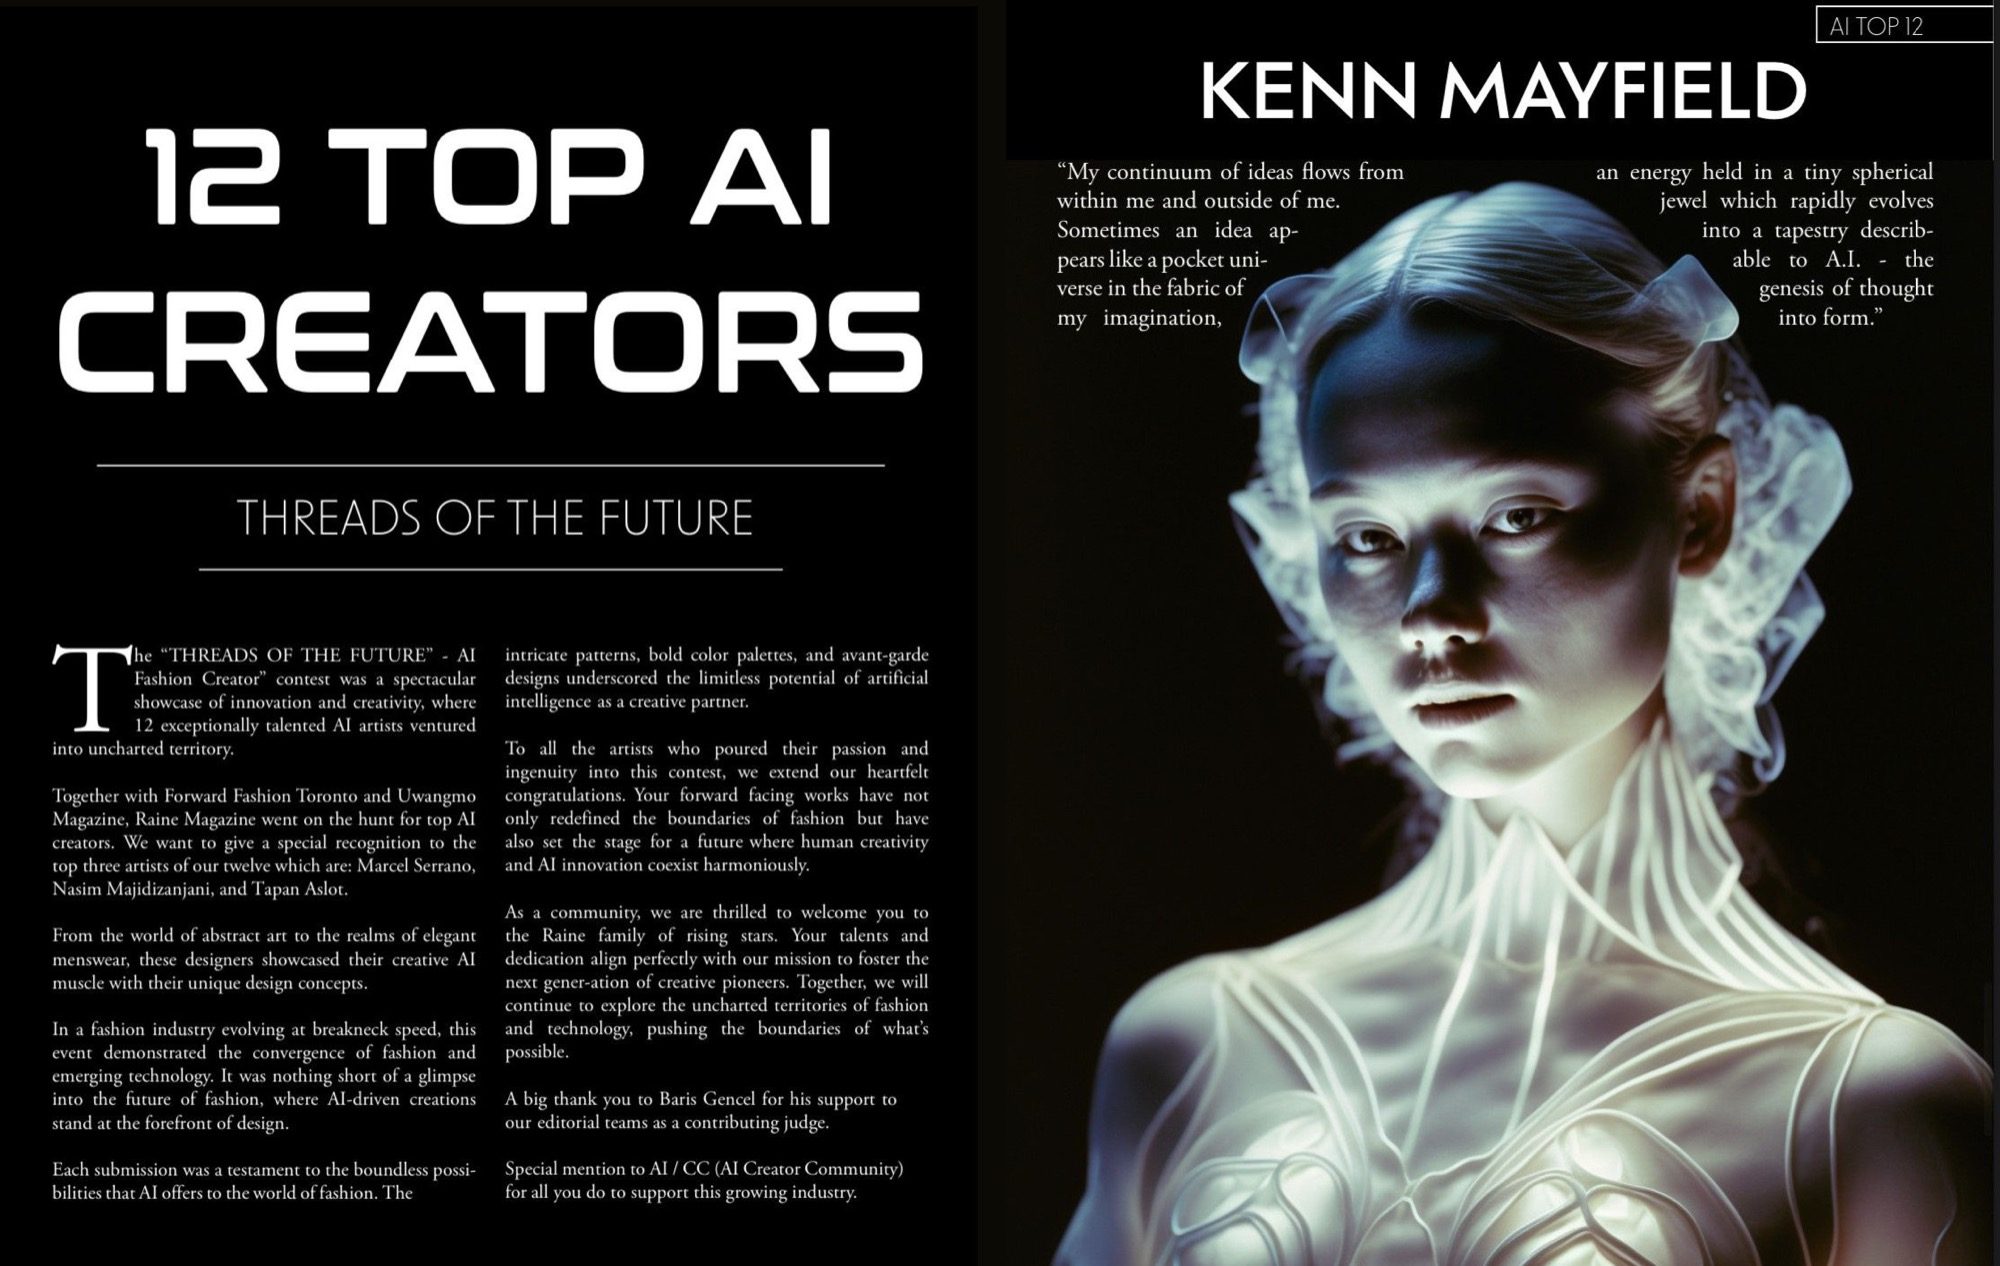
RAINE MAGAZINE
TOP 12 AI CREATORS
Thank you Nova Lorraine, MS Ugyen Wangmo for your generous invitation to your wonderful A.I. fashion Raine Magazine article, "12 Top A.I. Creators". 🌟
I'm elated to be included alongside incredible designers including Marcel Serrano, Nasim Majidizanjani, Tapan Aslot, Fatima Alhussein, Sherry Horowitz, Nitish Sarkar, Tridib Ghosh, and so many other explorers in this realm. 💫
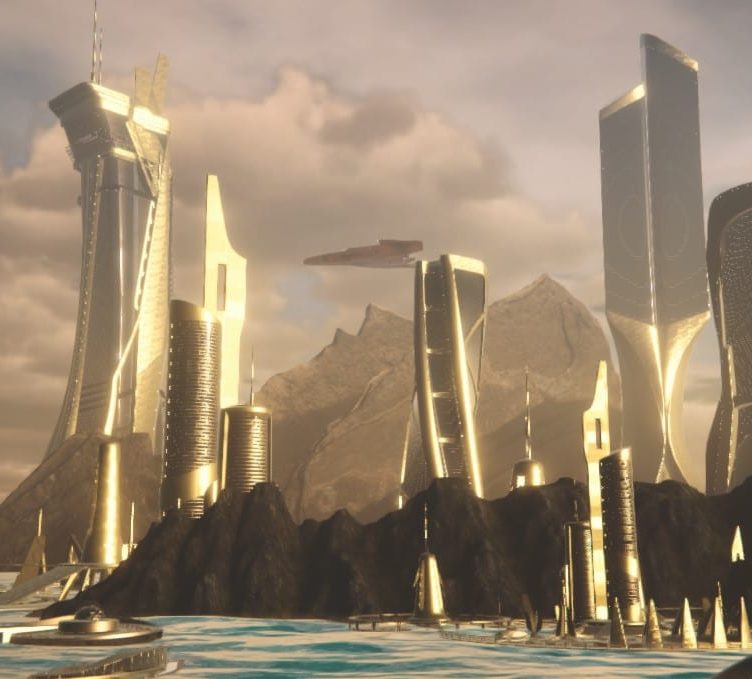
Immersive AI-driven 3D Worlds
Our worlds come to life with the power of AI, creating dynamic and interactive experiences like never before. Get ready to be fully immersed in a breathtaking virtual universe.
Cutting-edge Avatars
Experience truly realistic and AI-driven avatars that can engage in meaningful conversations. Our avatars are designed to be lifelike and responsive, enhancing the sense of presence in virtual spaces.
High Visual Standard
We believe in the power of visual storytelling. That's why our 3D worlds and avatars are crafted to the highest visual standard, ensuring a visually stunning and captivating experience for our users.
Creative Partnerships
We collaborate with industry-leading creatives in gaming, art, and technology to bring you innovative and groundbreaking experiences. Our partnerships ensure that our creations are at the forefront of virtual reality and metaverse development.
Passionate Creators
Xyris XR is a team of passionate creators dedicated to pushing the boundaries of virtual reality and the metaverse. With expertise in gaming, content creation, 3D design, AI, and art, we strive to create immersive experiences that captivate and inspire. Through our cutting-edge technology and collaborative mindset, we aim to revolutionize the way people interact with virtual worlds and avatars.

Join Our Virtual Universe
Highly qualified and motivated professionals
Step into a world of endless possibilities and immerse yourself in our AI-driven 3D worlds and avatars. Whether you're a scientist, gamer, or creator, Xyris XR has something extraordinary waiting for you. Join us on this groundbreaking journey and be a part of the future of virtual reality.
©Copyright. All rights reserved.
We need your consent to load the translations
We use a third-party service to translate the website content that may collect data about your activity. Please review the details and accept the service to view the translations.